Why This Matters 
Most companies know their scrap rates or customer complaints. But very few truly understand the total cost of quality (CoQ).
The danger? Hidden losses remain invisible — and leadership misses opportunities to reduce cost, increase profit, and strengthen ISO 9001 compliance.
By visualizing CoQ in dashboards and KPI trees, you transform abstract costs into actionable insights that drive real improvement.
Step 1: What Is Cost of Quality? 
CoQ is the total cost of ensuring quality, plus the cost of failures.
It’s divided into 4 categories:
- Prevention Costs → Training, audits, SOP development
- Appraisal Costs → Inspections, testing, calibration
- Internal Failure Costs → Scrap, rework, downtime
- External Failure Costs → Returns, warranty claims, lost customers
If you only measure defects or scrap, you’re missing 75% of the story.
Step 2: Why Companies Struggle With CoQ 
- Focus only on visible costs (scrap, returns)
- Data scattered across spreadsheets and departments
- Leadership sees quality as a compliance expense instead of a profit driver
 Example: A company spends $60K/year on inspections, but $400K on rework — an imbalance that screams for more prevention.
Step 3: Visualize CoQ With Dashboards 
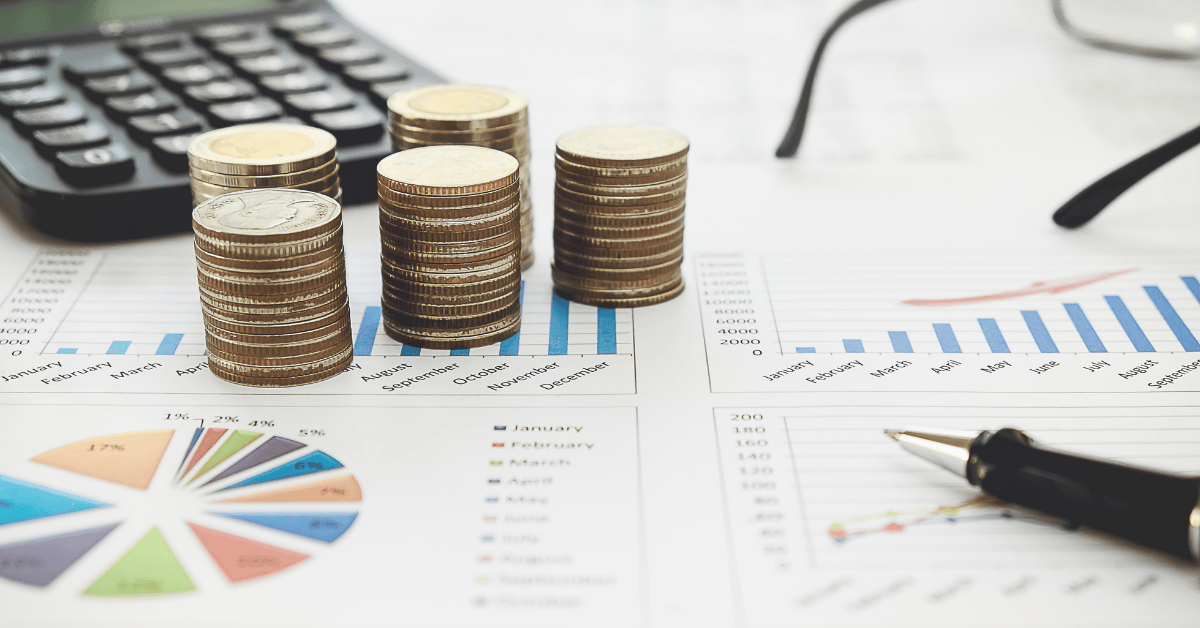
Dashboards turn CoQ into a story leadership can’t ignore.
 Practical Dashboard Elements:
- Pie Chart → Prevention vs. Appraisal vs. Failure costs
- Trend Line → CoQ % of sales (benchmark: 2–4% = world-class)
- Pareto Chart → Top recurring failure costs
- KPIs → Scrap $/month, CAPA closure rate, return %
Tools: Excel + Power Query, Power BI, or Tableau.
Step 4: Turn Insights Into Action 
CoQ is only valuable if you act on it:
- High internal failures → Better SOPs, error-proofing, operator training
- High appraisal costs → Automate inspections, shift to process controls
- High external failures → Stronger supplier controls, faster complaint handling
Rule of Thumb: Shift resources from failure/appraisal → prevention. That’s where ROI lives.
Step 5: Case Example
Industry: Electronics Assembly
Challenge: Scrap and customer returns eating profit
Actions Taken:
- Built CoQ dashboard in Power BI
- Identified imbalance: 70% of costs in failures, <10% in prevention
- Reallocated $150K from inspections → operator training & process redesign
Results (12 months):
- Scrap ↓ 35%
- Returns ↓ 50%
- Net savings: $450K in year one
Key Takeaways 
- CoQ exposes hidden financial losses behind quality issues.
- Dashboards make data actionable for both shop floor and leadership.
- Shifting spend toward prevention delivers the greatest ROI.
- CoQ links directly to ISO 9001 Clause 9.1 — performance evaluation.
Ready to Make Your Quality Costs Visible? 
At QMS Outsourcing, I help companies design CoQ dashboards that reveal hidden losses and guide smarter investments in quality. Let’s turn your QMS into a profit engine.
 Contact: eduardo.galindez@qmsoutsourcing.com
#CostOfQuality #ISO9001 #QMS #DataDriven #KPIDashboards #ContinuousImprovement #OperationalExcellence

Leave a Reply
You must be logged in to post a comment.